


Retention is greater than acquisition, nevertheless, most companies spend more money on acquisition because they think it is a quicker way to increase revenue.
In reality, customer retention is faster and costs up to seven times less than acquisition.
It is actually easier to retain customers that you already have a positive relationship with, rather than attempting to attract, educate and convert new customers.
Retention is also a more sustainable business model, and it is key to sustainable growth.
A study done by Bain & Company (inventors of the Net Promoter score) showed that increasing customer retention by 5%, can lead to an increase in profits from between 25 to 95%.
According to the study, the likelihood of converting an existing customer into a repeat customer is 60 to 70%, while the probability of converting a new lead is between 5 to 20% at best.
So in this review of retention as a growth strategy, we will be looking at bad retention, good retention, and great retention. We'll also be exploring the impact of retention on revenue, as well as calculations you may want to consider before diving into a retention effort.
What does average retention look like
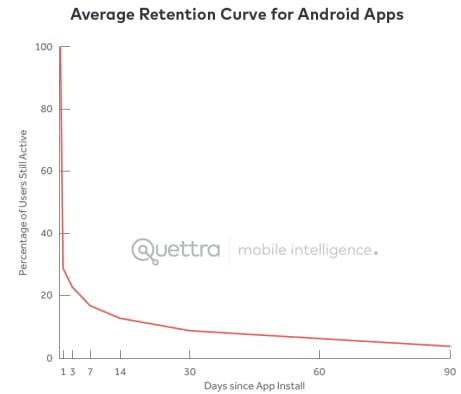
Above is the average retention curve for Android apps. It shows the number of days since the app was first installed, along with a percentage of active users on each day since the initial installation.
The graph shows that 75% of active users are gone on day 3 and within 30 days, 90% of active users are lost. After 90 days, only 5% of initial users remain active.
While these are the average retention rates, when we take the level of distraction into consideration, the task of retaining users becomes clearer.
So what do we do to improve retention?
According to the guy who put this data together
“Most of the leverage in improving these retention curves happen in how the product is described, the onboarding flow, and what triggers you set up to drive ongoing retention.” -Andrew Chen
He also says that
“Bending the curve happens via activation, not notification spam.” -Andrew Chen
If you can forecast how many people will be using your product, you should also be able to project how much money you'll be making. So, let's look at what your revenue looks like broken down by cohort when you have poor retention.
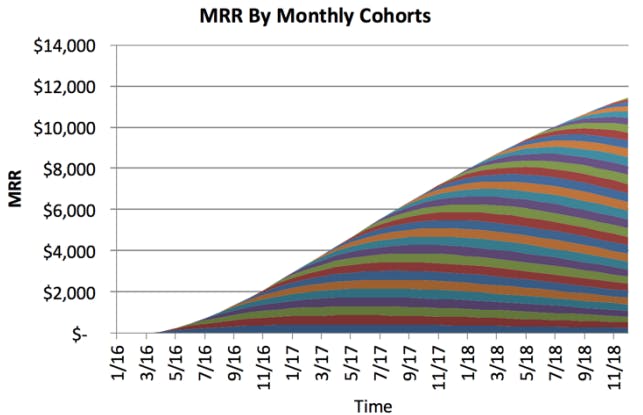
Dan Wolchonok, who is the head of product and analytics at Reforge, thought it would be interesting to model out what different types of retention looked like for a SaaS product.
So he hypothesized what it would look like if you acquire the same number of users over time, without hanging onto them.
He wondered what it would look like if you had really good retention, and then what are the tipping points for user growth, and he wrote about this on his blog.
So, he built a couple of simple Excel models, and these graphs that we're looking at come from that.
What does good retention look like?
Mix panel conducted research and discovered that most apps and software have a 6 to 20% eight-week retention rate depending on their industry.
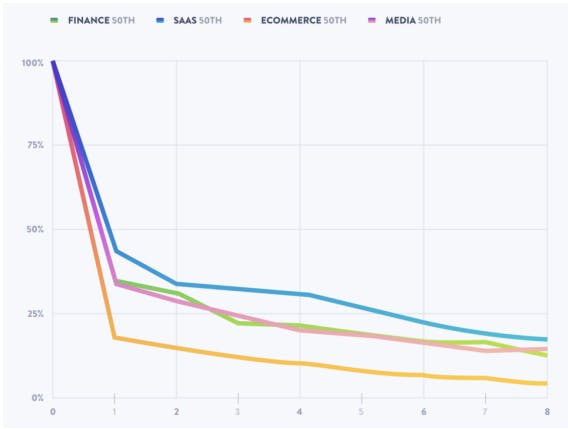
As we can see from the graph, For most industries, the average eight-week retention is below 20%. For products in media or finance, an eight-week retention rate of over 25% is considered elite at over 25% of retention. For SaaS and e-commerce, over 35% retention is at elite status. Insights like these are good due to the necessity of benchmarking retention curves in order to estimate revenue potential for each uplift I'm retention rates.
What does great retention look like?
Great retention doesn't mean that you keep every single customer forever and ever, not a flat line
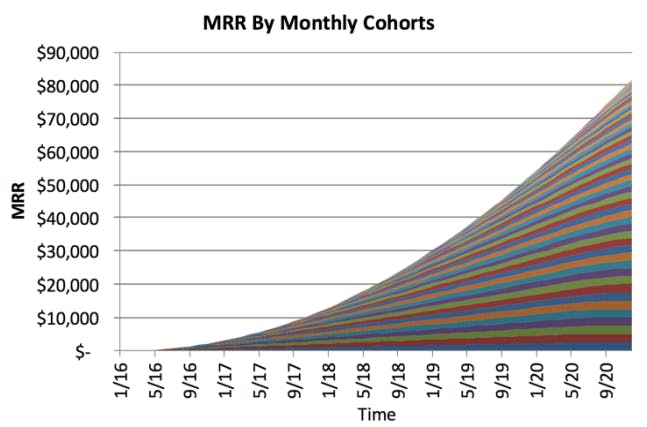
Going back to Dan's model, let's assume that 10% of the long-term users end up paying for your product and they pay say $50 a month. They don't immediately upgrade. That happens slowly over time. What would that graph look like? Dan wondered too, and he put the graph together. It looks like this. At the end of this five year period, you're making $80,000 a month in recurring revenue
So, there are two ways that products can benchmark retention which are:
- Benchmarking against themselves or
- Benchmarking against other companies
Measuring against your own performance week after week and month after month is called retention analysis, and it reveals trends. E.g. if your retention is trending down, you might be concerned and try to isolate the causes. If it's up, you might try to isolate what changed in features, marketing campaigns, behaviors of new customers that led to that growth, etc.
Once you know the positive retention influences, you can amplify them and vice versa.
When you're measuring retention against other companies you need competitors' performance statistics, which usually aren't available to the public. In that case, you'll need industry benchmark studies like Mix panel's Product Benchmark Report.
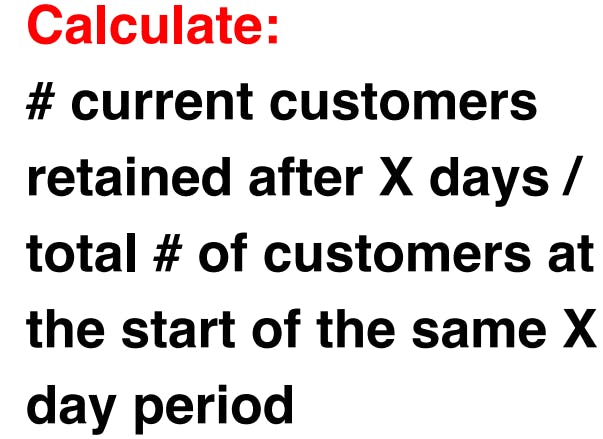
How to calculate retention rates A retention rate is the percentage of customers who are still with the company after a specific period of time. It explains whether or not a user who's performed an action, returns to perform another action after a given period of them. If the answer is yes, the user has been retained. If not, then that user has churned.
To calculate retention we need four things, three of which are specific to both the industry and the company or product. These are:
- Relevant user actions
- Relevant Timelines
- Number of actions that constitute retention
- The retention formula
*What is a relevant action? * By default, most companies define action very loosely. It's typically referred to as any event the user takes with their platform, including simply opening it.
To get a more refined sense of whether they're actually measuring the users' likelihood to return, some product teams tighten up that description and include only valuable events e.g. a purchase, signup, completing an onboarding checklist, or social shares, etc.
What timelines are relevant to retention calculations? **
For a lot of consumer-facing apps, it's common to track several timelines, such as one-day retention, one-week retention, two-week retention, etc.
The product team should base the period length on where they see drop-offs in returning users.
Most apps and software have a 6 to 20% eight-week retention rate depending on the industry. Product teams with that range in mind should work back from that point. So, if you are in the software industry you're going to work back from that eight-week point.
The point that you're looking for is typically where the percentage of users drops below the point where the revenue they generate covers the acquisition cost for all those users acquired at the beginning of the period
How many actions within that time period constitute retention? You want to decide, is it one action, three actions, or some combination of valuable actions.
Maybe it's making a payment and converting to a premium user, or taking an action in the app and upgrading your account.
When all three above have been answered, we can then plug the values into the retention formula below:
Note: It is vital that you know your customer lifetime value or CLV (where CLV is the total worth of a customer to your business over the whole period of the relationship)
This is because the cost of acquisition for a customer must not exceed the CLV
A rough rule of guidance is that LTV should be about three times CAC for a viable SaaS or another form of recurring revenue model.
Most public companies like Salesforce and HubSpot have returns that are about five times their acquisition cost. So you want to recover your customer acquisition cost in less than 12 months, or your business is going to take way too much capital to actually grow.
Based on this formula and the associated insights, it is evident that the CAC costs must be precisely calculated so that you can set goals to compensate for losses and generate profit.
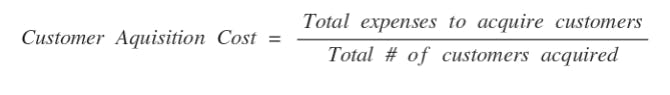
Read: Customer Retention Strategies: 4 Phases for Development But how do we calculate customer acquisition costs?
There are several ways to calculate CAC, but here's a straightforward formula.
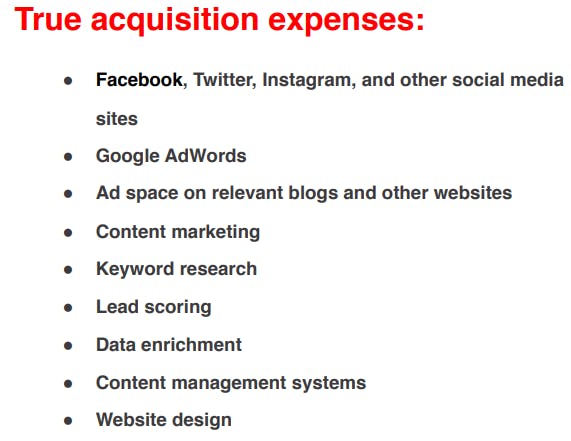
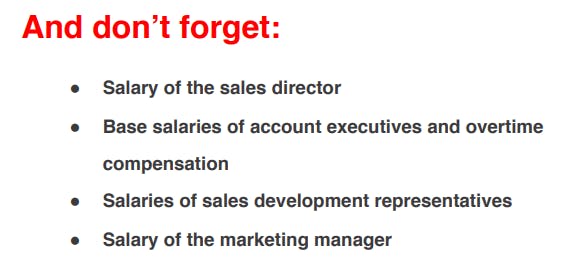
To calculate your true acquisition expenses, you must think through every single expense that it takes to get a new customer e.g.
Point to note: You don't want to think about freemium users as acquired customers when you calculate your CAC into that LTV to CAC ratio Your freemium users are not yet acquired customers.
People on a free or trial plan are using your service, but you have no guarantee that they are going to pay you any money.
There's no lifetime value from those users yet. If you put those users in your total count of acquired customers and consider them to be acquired, it will end up skewing your CAC estimations
In Summary
Does your retention rate map to your industry's standards?
Have you mapped your cohorts?
Here are links to the spreadsheets and supplementary resources that can help you get started. Good luck
Supplemental materials
Primer on cohorts and cohort analysis
Dan Wolchonok’s open-source cohort mapping spreadsheets: